You need to know whether your measurement system is trustworthy before you trust Cpk, control charts, or pass/fail decisions. This Gauge R&R pad takes either an X̄-R MSA worksheet summary (R̄, operator mean range, part mean range, parts/operators/trials) or direct EV/AV/PV components, then returns GRR, %GRR against both tolerance and study variation, component shares, NDC, and AIAG Acceptable / Marginal / Unacceptable gates.
Defaults open on X̄-R summary: R̄ 0.012, X̄diff 0.02, Rp 0.25, 10 parts, 3 operators, 2 trials, tolerance 1, K = 6. CALCULATE returns GRR ≈ 0.094, %GRR (tolerance) ≈ 9.4% (Acceptable), %GRR (study) ≈ 19.0% (Marginal), NDC = 7. Switch to EV/AV/PV for the component path (defaults EV=AV=0.01, PV=0.05, Tol=0.20). Math stays in your browser.
It sits under Fixture & Tooling Calculators next to the tolerance stack-up calculator and GD&T true position calculator. This pad is Average & Range MSA — not full ANOVA from raw tables, attribute agreement, or nested destructive studies.
Formula
- X̄-R: σ_EV = R̄ / d2(r); EV = K · σ_EV (K = 6 default, or 5.15 legacy).
- σ_AV² = max(0, (X̄diff / d2(k))² − σ_EV² / (n · r)); AV = K · σ_AV.
- σ_PV = Rp / d2(n); PV = K · σ_PV.
- GRR = √(EV² + AV²); TV = √(GRR² + PV²).
- %GRR (tolerance) = GRR / Tol × 100; %GRR (study) = GRR / TV × 100.
- NDC = floor(1.41 × PV / GRR). AIAG gates: <10% acceptable, 10–30% marginal (includes 10%), >30% unacceptable.
Reproduce the default X̄-R path on CALCULATE (K = 6):
| Quantity | Value |
|---|---|
| Inputs | R̄ 0.012 · X̄diff 0.02 · Rp 0.25 · n=10 · k=3 · r=2 · Tol=1 |
| EV / AV / GRR | ≈ 0.0638 / 0.0694 / 0.0943 |
| PV / TV | ≈ 0.487 / 0.496 |
| %GRR tolerance | ≈ 9.43% → Acceptable |
| %GRR study variation | ≈ 19.0% → Marginal |
| NDC | 7 |
How it works
Enter Xbar-R MSA worksheet summaries (R-bar, operator mean range, part mean range) or paste EV/AV/PV components. The pad returns GRR, %GRR against both tolerance and study variation, component shares, NDC, and AIAG Acceptable / Marginal / Unacceptable gates. Sigma multiplier defaults to 6 (AIAG 4th ed.); 5.15 remains available for legacy 99% studies.
Choose Entry mode (X̄-R study summary or EV/AV/PV components). On X̄-R, pick Sigma multiplier K (6 or 5.15) — K is hidden in component mode because EV/AV/PV are already study-variation widths. Enter worksheet summaries or components plus tolerance (USL − LSL). CALCULATE fills Results (variation stack, dual %GRR, NDC, AIAG status). Editing a field clears Results. RESET restores X̄-R defaults with K = 6.
EV, AV, and why %GRR has two denominators
Gauge R&R guides start from the same identities: GRR = √(EV² + AV²) and TV = √(GRR² + PV²). EV is repeatability (same appraiser, same part, repeated trials). AV is reproducibility (appraiser-to-appraiser). PV is the part-to-part signal you want the gage to resolve.
Report both %GRR figures. %GRR vs tolerance (GRR/Tol) governs inspection and conformance. %GRR vs study variation (GRR/TV) governs process discrimination and SPC. The default study here is Acceptable on tolerance (~9.4%) but Marginal on study variation (~19%) — a common split when the process spread is much tighter than the spec width.
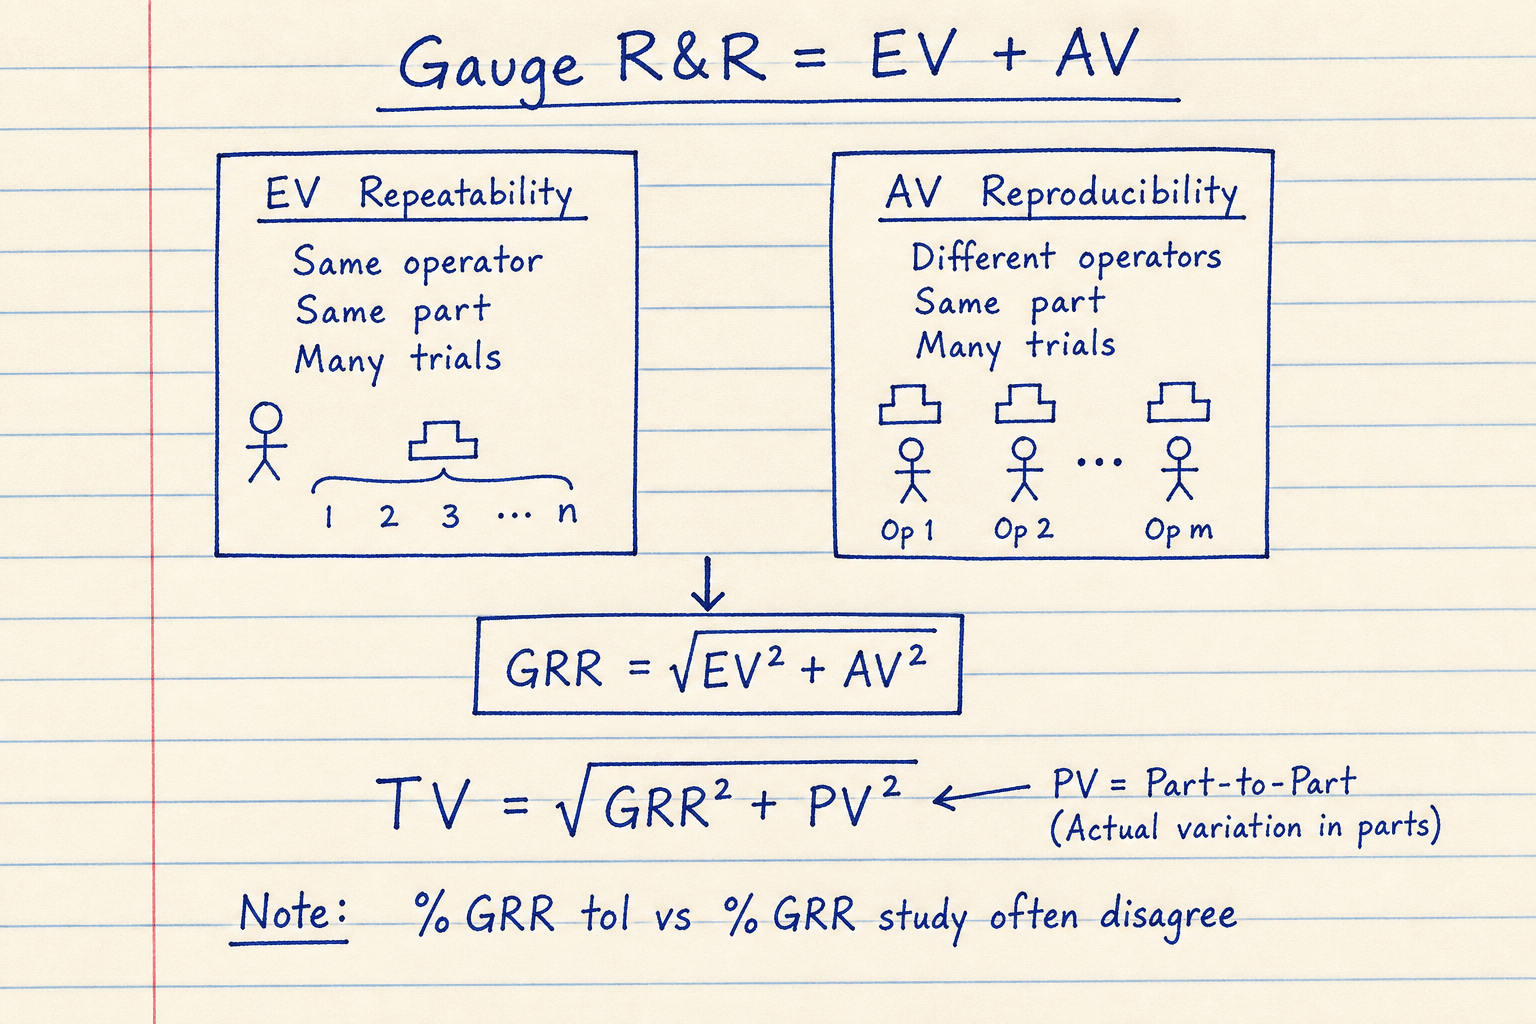
Default CALCULATE path: GRR ≈ 0.094 inside TV ≈ 0.496 → study %GRR ≈ 19%.
Component mode example: EV=AV=0.01, PV=0.05, Tol=0.20 → GRR≈0.01414, study %GRR≈27%, NDC=4 (floor; rounded GRR 0.0141 yields NDC=5).
AIAG gates and NDC
Acceptance bands cited by shop MSA manuals match AIAG MSA 4th Edition guidance: under 10% acceptable, 10–30% marginal (application-dependent), over 30% unacceptable. NDC = floor(1.41 × PV/GRR) should be at least 5 before you trust the gage for process control.
Critical characteristics in automotive, aerospace, and medical work usually demand the green band on the metric that matches the decision — tolerance for ship/accept, study variation for SPC. Do not ignore NDC when %GRR alone looks fine.
AIAG %GRR interpretation:
| %GRR | Assessment |
|---|---|
| < 10% | Acceptable |
| 10–30% | Marginal — may be OK depending on risk/cost |
| > 30% | Unacceptable — improve the measurement system |
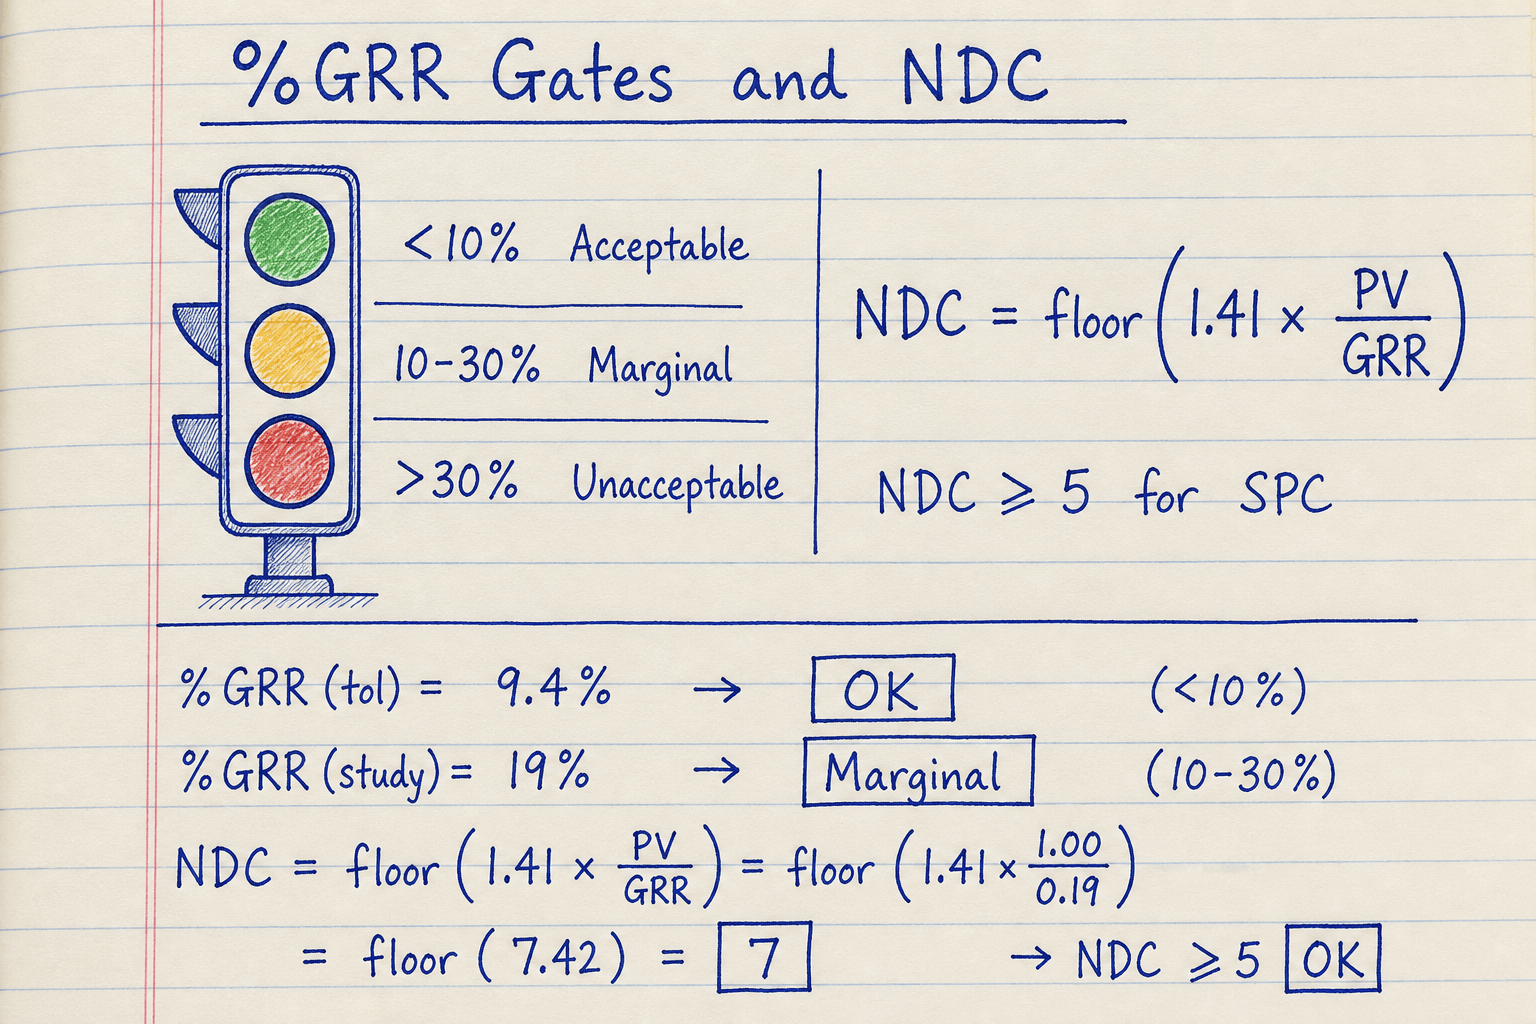
Default study: tolerance gate green, study-variation gate amber, NDC 7.
Sigma multiplier K defaults to 6 (AIAG 4th ed.); choose 5.15 only when your customer still requires the older 99% study width.
X̄-R summary vs ANOVA and attribute MSA
Full-table ANOVA MSA tools ingest Part × Operator × Trial rows and estimate interaction terms. This pad stays on the Average & Range summary path: paste R̄, X̄diff, and Rp from your worksheet (or enter EV/AV/PV if you already computed them).
Use attribute agreement analysis for pass/fail or categorical gages. Use nested studies when operators cannot measure the same parts (destructive tests). Those modes are out of scope here.
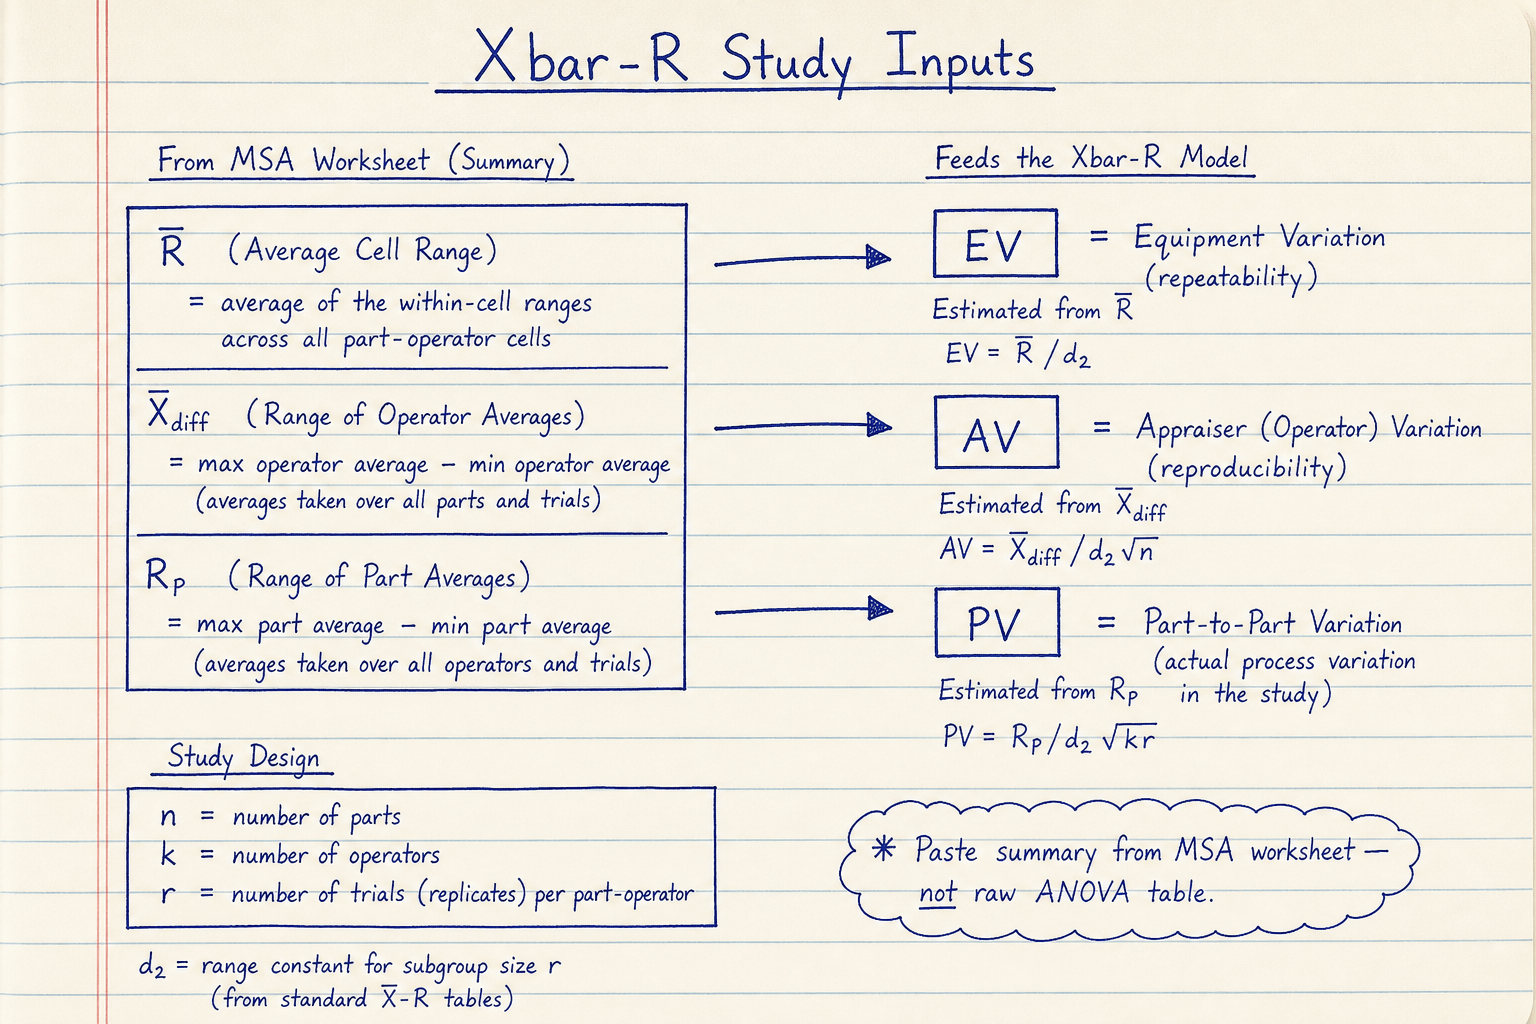
Standard study shape: 10 parts × 3 operators × 2–3 trials, parts spanning the process range, randomized and blinded where practical.
d2 constants use the common Shewhart (g→∞) table keyed by trials, operators, and parts.
Worked example
Default X̄-R summary with K = 6 and tolerance = 1.
- σ_EV = 0.012 / 1.128 ≈ 0.01064 → EV ≈ 0.0638
- AV ≈ 0.0694 after operator-range correction; GRR ≈ 0.0943
- PV ≈ 0.487 → TV ≈ 0.496; NDC = floor(1.41 × PV/GRR) = 7
- %GRR tol ≈ 9.4% (Acceptable); %GRR study ≈ 19% (Marginal)
Result: Tolerance gate passes; study-variation gate is marginal — tighten the gage before heavy SPC use.
When to use
- Validating a gage before capability studies or control charts
- Turning an MSA worksheet summary into %GRR, NDC, and AIAG status
- Comparing tolerance-based vs study-variation %GRR for the same data
- Quick EV/AV/PV what-if checks when components are already known
Limitations
- X̄-R summary or EV/AV/PV only — not ANOVA from raw measurement tables
- Not for attribute / pass-fail gages (use attribute agreement analysis)
- Not nested/destructive MSA or linearity & bias studies
- d2 uses Shewhart g→∞ values; finite-g d2* tables can differ slightly
- AIAG % gates are guidelines — follow your customer or quality manual
FAQ
- What %GRR is acceptable?
- AIAG-style guidance: under 10% acceptable, 10–30% marginal, over 30% unacceptable. Always state whether the percentage is vs tolerance or vs study variation — they often differ.
- Why do %GRR (tolerance) and %GRR (study) disagree?
- Tolerance % uses the specification width; study % uses the observed total variation in the study. A tight process inside a wide tolerance can look good on tolerance % and marginal on study % (or the reverse).
- What is NDC?
- Number of distinct categories — how many groups the gage can reliably distinguish within the part variation. NDC ≥ 5 is the usual minimum for process control; ≥ 10 is excellent.
- Should I use K = 6 or 5.15?
- AIAG MSA 4th Edition commonly uses 6 (~99.73% coverage). 5.15 is the older ~99% study width still required by some customers. Pick the K your procedure specifies and keep it consistent across reports.
Tolerance Stack-Up Calculator
1D loop stack-up with worst-case, RSS, adjusted RSS, Cp/Cpk, and contributor ranking — Metric or Imperial.
Open calculatorGD&T True Position Calculator
Diametral true position from X/Y deviations with RFS, MMC, or LMC bonus — Metric or Imperial, 2D or 3D.
Open calculatorISO 286 Tolerance Calculator
ISO 286 hole/shaft limits, deviations, and clearance / transition / interference fit type.
Open calculator